
.jpg)
Key takeaways
- We tested 10,000 email addresses across 251 domains, every one of them a catch-all domain, using 500 real professionals (about 5,000 email permutations) and 5,000 fictional addresses, across 11 tools in August 2026.
- Seven of the fourteen tests left at least 94% of all 10,000 records unresolved. On a list made entirely of catch-all domains, most of the market returns inconclusive results.
- Real contacts found ranged from 4% to 98.2% of the 500 real people. Showing the large variance in performance on catch-all domains (which are the most challenging to verify).
- Allegrow found the most real people: 491 of 500 (98.2%), ahead of ZeroBounce at 470 and BounceBan at 460.
- Million Verifier appears to have the highest false-positive (‘error’) rate, rating 640 of 5,000 fictional addresses as valid, with a ~12% false-positive rate overall.
- The examples shown are for informational purposes. We list the entirety of the required steps to re-create the study and run it with your own data and chosen email verification tools.
Introduction
Most email verification tools advertise close to a ~98% accuracy rate. These rates typically don’t take into account coverage (meaning, how many of the contacts you send for verification are successfully verified), or provide clear comparisons across the top verification services available in the market.
On catch-all domains none of it measures the thing that decides whether verification was worth paying for, which is whether the tool can resolve a specific contact into a definitive, actionable status rather than handing it back undecided.
So we created a methodology to measure the best email verification products in the market based on both quality and coverage. In August 2026, we assembled 10,000 addresses at 251 domains that are all catch-all, mixing 500 real professionals (ten potential emails for each = 5,000 in total) with 5,000 invented addresses (completely fake people), and ran the identical list through11 tools. The study counts three things: how many of the 500 real people each tool found, how many of the 5,000 invented addresses the verifier wrongly called valid, and how much of the full 10,000 had a conclusive verification decision (rather than declining to verify a challenging record).
The headline result is that most of the market cannot resolve a large portion of the B2B market’s email domains. Seven of the fourteen tests left at least 94% of the list unresolved, returning "catch-all","unknown", or "risky" on almost everything. Six of them found fewer than 45 of the 500 real people. This means there’s a significant difference in coverage across the various options in the market. If you are trying to work out which are the best email verification tools for a B2B list, the answer could depend heavily on how much of your target market is on catch-all domains.
We should note catch-all domains are not a rare setup. Google runs one.So do Netflix, Stripe, Databricks, Nvidia and The New York Times, alongside 245 other domains in this test. Our census of the Fortune 500 found 47% of those companies behaving as catch-all and 69% catch-all, gateway-fronted, or both. These are the enterprise domains B2B teams target the most, and they are the accounts many verification tools aren’t able to resolve.
Study at a glance
The three metrics
- Real contacts found, out of 500. Counted per person: found if the tool returned a conclusive valid result on at least one of that person's permutations.
- False positives, out of 5,000. Measured only on the invented set, the one group where we know for certain no mailbox should exist.
- Unresolved, out of 10,000. Any status expressing uncertainty. A record counts as resolved only when the tool made a clear decision either way.
Email verification tools compared: how all 11 performed on catch-all domains
Every tool received the identical 10,000-record list. The table is ranked by real contacts found, and that ranking carries through the rest of this article.
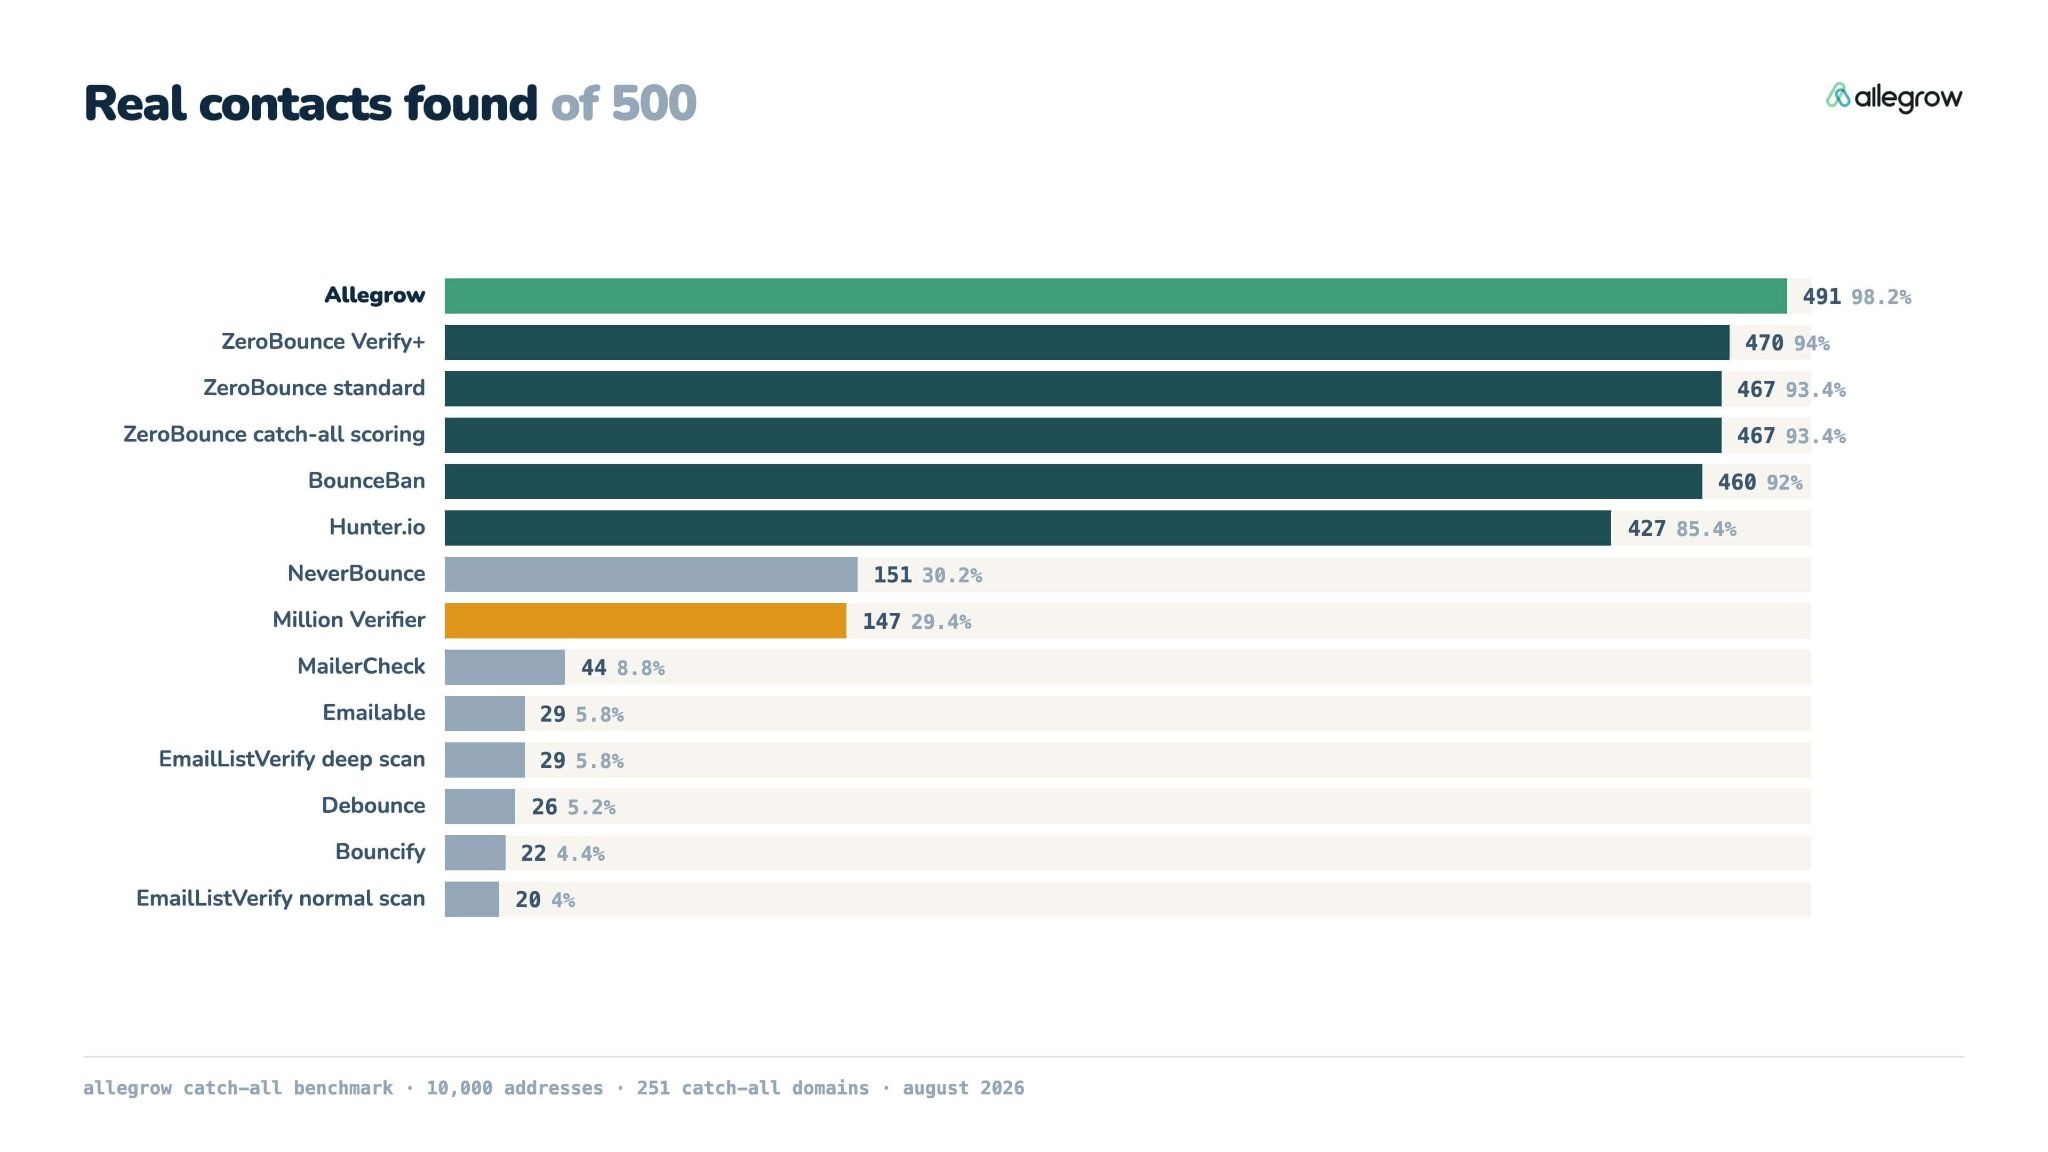
There are really two distinct groups which the study highlights: (1) those that can do catch-all verification reliably, and (2) those that have low enterprise coverage. Six tests found more than 400 of the 500 real people. Seven left at least 94% of all 10,000 records undecided, and six of those found fewer than 45 people. Allegrow found the most real people, 491 of 500, combined with one of the lowest false-positive rates in the test.
One warning before reviewing the false-positive column in isolation. A tool that answers "unknown" to all 10,000 records could post a perfect 0% error rate but provide limited value because none of the verifications were definitive. In the study, Debounce and Bouncify recorded only a single error in 5,000, but both found fewer than 30 of the 500 real people while declining to decide on roughly 95% of the list.
Guidance on interpreting the results
The three metrics provided shouldn’t be considered in isolation, and it isn’t practical to optimize for just one metric. What ultimately matters is how many real, reachable contacts a tool gives you, and at what error rate.
A verification tool exists to tell you whether you should email a specific person, and there are two primary ways to fail at that: (1) the tool can mark a record valid when it isn’t, or (2) a tool can decline to return a decision, which means you’re unable to fully verify the contact.
A tool with minimal catch-all coverage could post a minimal error rates because it verifies a very low number of emails: meaning the surface area for mistakes is reduced, but so is the helpfulness of the tool. Debounce had one false positive across 5,000 invented addresses, but it also only found 26 of 500 real people and left 94.8% of the list unresolved. As an example, that single error, is best read in the context of coverage, reflecting how few verifications the tool attempted rather than exceptional precision.
The difference between the two failure types is visibility. A high false positive rate shows up as bounces and low engagement rates, while an unresolved record is a person you could have reached but never will. On catch-all domains, those unresolved records sit inside the enterprise accounts a B2B team most wants to reach.
Therefore, a practical way to review the results is: the job is to resolve the list correctly, and a false-positive rate is meaningful alongsidethe share of the list a tool was able to verify. Considering these all included verifiers generally fall into one of these three categories:
Hunter.io sits at the lower edge of the first group, resolving a fair percentage of the list but leaving 744 records undecided, which places it between the two clusters rather than squarely in either.
The practical upshot is a better set of questions for a vendor. An accuracy percentage on its own tells you almost nothing, because you cannot tell whether it was earned by being right or by refusing to answer. Ask instead: how many real people did you find? How many invented addresses did you call valid? And what share of the list did you leave unverified? By answering these three questions, you can quantify performance.
How we ran the test
The whole point of a study like this is that you can repeat it with your own data. So here is the full method, including the choices we made and the reasons behind them.
The dataset: 251 catch-all domains and 10,000 addresses
We started with the domains, not the people. Every one of the 251 domains in this test is a catch-all, checked before anything else went ahead. That is what makes this a catch-all benchmark rather than a general accuracy test: we did not take a mixed list of companies and let a few catch-alls fall in, we built the whole set out of them deliberately.
The 10,000 records split evenly. About 5,000 are name permutations for 500 real people, and 5,000 are fictional addresses at those same real domains.
These are not obscure companies. They are the accounts B2B teams actually chase:
- Big tech and consumer internet: Google, Netflix, Spotify, Uber, Lyft, Airbnb, Pinterest, Dropbox, Shopify, DoorDash, Grubhub, Roblox
- Developer and data infrastructure: GitLab, MongoDB, Databricks, Datadog, Figma, Vercel, Zapier, MariaDB, LaunchDarkly, Fivetran
- Fintech: Stripe, Coinbase, Chime, Betterment, Wealthfront, Ramp, Carta, Fidelity
- Industrials and enterprise: Honeywell, BP, Eaton, Air Liquide, Airgas, Avery Dennison, Trimble, Veolia, Kiewit, Nvidia
- Media and research: The New York Times, the Financial Times, Axios, Nielsen, Qualtrics
- Health and life sciences: Veeva, Zocdoc, Ginkgo Bioworks, 10x Genomics, AbCellera, Hinge Health
How we identified the real people
The 500 real professionals came from public LinkedIn employee data at those 251 domains, so each one is a person who genuinely works there as far as public record shows.
For each person we generated around 10 candidate addresses using the standard business email formats: first.last@, flast@, f.last@, first@ and the other common patterns. That is the same permutation approach an email finder uses, and it matters for how you read the results. Finding a contact here is not a database lookup. It means picking the one live address out of roughly ten plausible guesses at a domain that accepts all of them. The strongest way to build a ‘real people’ set is to plant contacts you know personally or have seen responses from recently; that is how we would construct the ideal coverage test. Because that data can’t be shared publicly, we used the public-data method above for this informational example.
How we built the control group
The 5,000 invented addresses use obvious fictional character names at the same real domains.
The obviousness is deliberate. A random string of letters would likely be rejected by simple syntax grading, and it would not catch the type of false positives that occur in real life with guessed email addresses. A famous fictional character (e.g. Yoda) is not likely to work at Stripe, so when a tool calls that address valid we can say with reasonable confidence it got it wrong.Reasonable rather than total: at companies this large, an ordinary-sounding character email permutation will occasionally belong to a real employee, and the shorter permutation formats make that more likely. But in these cases, we counted them as errors, therefore, consider this as a directional guide of error rate.
How each metric was counted
Real contacts found is counted per person, not per address. A person counts as found if the tool returned a conclusive valid result on at least one of their permutations. Finding three working addresses for the same person still counts once, because the outcome that matters is whether you can reach them.
False positives are counted only on the 5,000 invented addresses. This is a deliberate limit and it is worth explaining, because it may look at first like a gap. We do not score false positives on the permutation set, for two reasons: we have no way of knowing which permutations are genuinely wrong, and a person can legitimately have several working addresses through aliases. Marking those as errors would punish a tool for being right. The invented set is the only group where we know for certain that no mailbox should exist, so it is the only clean test.
Unresolved covers any status that expresses uncertainty, whatever a vendor calls it. Tools use different words for this (catch-all, unknown, risky, accept-all), so we applied one rule across all of them: a record counts as resolved only when the tool made a clear decision, either safe to send or clearly not. Anything else is unresolved.
What this study cannot tell you
- It is a point-in-time result, run at the end of July into early August 2026. Vendors change how their tools behave.
- The real people were identified from public LinkedIn data, not from reply history, so a person recorded as real is real as far as public record goes.
- Real contacts found is measured per person, so a tool that finds several working addresses for one person gets credit once.
- False positives are measured only on the invented set, for the reason given above.
- Each tool was run on its documented settings at the time.
- There is no pricing or speed comparison here, because we did not capture that data. We are not going to estimate it as it constantly changes.
Tool-by-tool results, ranked by real contacts found
The sections below are ordered by how many of the 500 real people each tool found, from most to fewest. Where a tool offers more than one verification mode, each mode is reported separately so it can be judged on its own terms.
1. Allegrow: 491 of 500 real contacts found
On a list of 10,000 addresses at 251 catch-all domains, Allegrow found 491 of 500 real people (98.2%), called 11 of 5,000 invented addresses valid (0.22%), and left 197 of 10,000 records undecided (2.0%).
That is the highest number of real people found in the study. The next best result was 470, then 467 and 460, so Allegrow returned between 21 and 31 more reachable people per 500 contacts than the best tools tested. It did that while making 11 errors in 5,000, against 9 for the lowest recorded. Those 11are worth explaining rather than just counting, and we come back to them at the end of this section.
Coverage really starts to matter when you want high verification coverage at scale.
Allegrow left 197 records undecided, a 2.0% rate, where threeZeroBounce modes and BounceBan had fewer unresolved. This is a deliberate choice in Allegrow’s verification logic: when reliable verification signals are absent, Allegrow conservatively marks these cases as unknown rather than assuming they’re valid or invalid. When services have an unknown rate below 1%on catch-all domains, in our opinion this typically indicates either defaulting to invalid or making rating decisions based on non-email data (e.g., a contributor network or LinkedIn scraping). Allegrow has chosen to base verification results on email server data rather than alternative data sets or defaults, because those introduce a lack of transparency into how verification ratings are made.
A note on those 11 errors. The control group uses obvious fictional character names, but these are 251 of the largest employers in the world, and the permutations those names generate can collide with real people: mscott@ could belong to our planted Michael Scott or to a real Maria, Mark or MeganScott at the same company. A tool that returns valid for such an address may be right about actually being valid coincidentally. We counted all 11 as errors regardless for fairness. The same caveat applies to every error count in this study.
2. ZeroBounce: 470 of 500 real contacts found
ZeroBounce offers three verification modes, so we tested all three. The differences between them are one of the more useful findings in the study, particularly for anyone weighing up whether the paid catch-all add-on is worth it.
Standard is potentially the strongest of the three ZeroBounce options they offer. Standard found 467 of 500 real people and called 9 of 5,000 invented addresses valid. Unlike the tools further down the rankings ZeroBounce resolved 99.1% of the records. Finding 467 on a catch-all list means the tool is doing more than reading the server's blanket “accept” SMTP signal.
The paid catch-all scoring didn’t change results. Their catch-all scoring product took the 90 records standard had left undecided, scored each one, and resolved every one of them to invalid. Real contacts found stayed at 467. False positives stayed at 9. Therefore, the extra credits may remove the catch-all label without producing another reachable person. A different list composition might produce cases where scoring recovers a contact. On these 10,000 record sit recovered none.
Verify+ found 3 more people and made 16 more errors. It is an opt-in second phase that sends real test emails to the records that came back catch-all, then treats a bounce as proof the mailbox does not exist and the absence of one as proof that it does. That inference is the problem. Enterprise mail systems and secure email gateways are routinely configured to suppress non-delivery reports, so mail to an address that does not exist is silently discarded or rerouted rather than bounced. Nothing coming back is not evidence the person is real, and the false-positive count rising from 9 to 25 is an example of this occurring.
Across all three modes, the ceiling is the finding real people. Standard found 467, scoring found 467, Verify+ found 470. Whatever mode or phase a buyer enables,ZeroBounce lands on sourcing within three people of the standard settings. This is because the modes seem to change more how they label the records they cannot resolve rather than influence how many people they can find.
In summary, with 470 real contacts found, ZeroBounce is 21 short of Allegrow, while being a provider that has cleared dedicated resources to resolving catch-all emails. It’s possible ZeroBounce has more focused on B2C records with these other available configurations while Allegrow has a clear B2B focus to date.
3. BounceBan: 460 of 500 real contacts found
BounceBan found 460 of 500 real people (92%),called 9 of 5,000 invented addresses valid (0.18%), and left a single record of 10,000 undecided.
This is overall the strongest performance on unresolved rate. However, BounceBan sits 31 people behind Allegrow on identifying valid emails for real contacts, meaning that for roughly every 16 real contacts in your data set, you would miss one using BounceBan compared to Allegrow on this data.
A sub-1% unresolved rate for any tool on enterprise data may indicate it only shows unresolved when it didn't process a verification (a server error where the contact didn’t run), rather than choosing not to rate a contact when it sees weaker verification signals.
Typically, the way most platforms achieve an unresolved rate close to 0 is either defaulting to invalid with weaker signals or using non-email datasets (e.g., LinkedIn scraping, licensed contributor networks) to finalize the hardest verifications when server data is inconclusive. This can leave a blindspot where you’re either calling valid contacts invalid and missing leads, or unknowingly basing an email verification on data that isn’t owned by the provider.
Therefore, the largest challenges with BounceBan appear to be a lower find rate than other solutions in the market, while lacking a SOC 2 audit which some buyers require for scaled use-cases.
4. Hunter.io: 427 of 500 real contacts found
Hunter.io found 427 of 500 real people (85.4%), called 17 of 5,000 invented addresses valid (0.3%), and left 744 of 10,000 records unresolved (7.4%).
Hunter.io is the boundary case in this study. They sit well clear of the tools that have minimal coverage, resolving 92.6% of the list and finding more than four in five of the real people, but leave noticeably more unresolved addresses than the options above that specialize in enterprise email verification, which is demonstrated by Hunter missing 73 out of 500 real people in this example.
The pattern suggests Hunter performs generally well but may have a stronger SMB focus than some other options, given its lower rate of finding real enterprise contacts. It is worth noting the business seems to focus more on finding emails on public web pages rather than pure verification.
5. NeverBounce: 151 of 500 real contacts found
NeverBounce found 151 of 500 real people (30.2%), called 27 of 5,000 invented addresses valid (0.5%), and left 9,633 of 10,000 records undecided (96.3%).
That is the highest unresolved rate in the study. Fewer than four records in every hundred came back with a clear decision either way, which means a team running this list through NeverBounce would still have 96% of it to resolve by some other route, and 349 of the 500 real people unaccounted for.
The pattern defines the low-resolution group: reading the server's blanket acceptance, recognizing it as a catch-all response, and returning that uncertainty rather than further testing whether the individual mailbox exists. Notably, the caution did not create a clean error rate either, since NeverBounce came back with 27 false positives.
6. Million Verifier: 147 of 500 real contacts found
Million Verifier found 147 of 500 real people (29.4%), called 640 of 5,000 invented addresses valid (12.8%), and left 6,771 of 10,000 records undecided (67.7%).
This is the clearest example in the study of the opposite approach to the cautious group. Million Verifier resolved substantially more of the list than options with the same SMB focus, 3,229 records where verified by them, with 640invented addresses being marked valid.
This ~12.8% false-positive rate means around one in eight of the invented addresses was incorrectly returned as valid. Therefore, you may have high risk of sending to contacts that don’t exist. Bounce rates at that level damage sender reputation quickly, and the damage carries across every campaign sent from the same domain, not only the list that caused it.
67% of the list was still unresolved by Million Verifier, meaning in an enterprise you can expect lower coverage from this option. We’ve heard it’s common to stack Million Verifier alongside another option due to its historically low price point. Based on these results, the challenge with usingMillion Verifier as a first waterfall option is its higher false-positive rate, which could introduce errors into your data, which subsequently aren’t submitted to the 2nd and 3rd providers you stack.
7. MailerCheck: 44 of 500 real contacts found
MailerCheck found 44 of 500 real people (8.8%), called 49 of 5,000 invented addresses valid (1%), and left 9,436 of 10,000 records undecided (94.3%).
MailerCheck sits in the low-resolution group without the low error ratethat usually accompanies lower coverage. Its 49 false positives are thesecond-highest count in the study, and they arrived alongside 94.3% of the listleft undecided with 456 of the 500 real people not found.
To compare MailerCheck against other lower resolution providers they had:49 false positives, against 41 for Emailable, 27 for NeverBounce.
8. Emailable: 29 of 500 real contacts found
Emailable for background (acquired the firm Email Checker) is now owned by Cache Ventures. They found 29 of 500 real people (5.8%), called 41 of 5,000 invented addresses valid (0.8%), and left 9,426 of 10,000 records undecided (94.2%).
Emailable is in the same position as MailerCheck: firmly in the low-resolution group, but with a higher error count than some other options in this group. Debounce and Bouncify each recorded one false positive at a similar resolution rate, where Emailable recorded 41. It left 471 of the 500 real people not found.
Put simply, Emailable called 41 invented addresses valid while finding 29 real people, meaning more of its ‘valid’ results in this test were fictional characters than from the group of real human beings.
In summary, Emailable combines the low coverage of the cautious group with a higher error rate, which makes it a difficult fit for catch-all-heavyB2B data.
9. EmailListVerify: 29 of 500 real contacts found
EmailListVerify offers two scan modes, so we ran both. The deeper scan moves the numbers, though not enough to change the shape of the result.
The normal scan found the fewest real people of any of the fourteen tests that were ran. 20 of 500, and 95.7% of the list left unresolved. Whereas the low false positive rate of 2 errors in 5,000 looks like precision until we consider coverage: almost 96% of the records came back without a definitive valid or invalid result.
The deep scan verifies nominally more contacts in the context of the overall study (1.8% improvement in real contacts found), with one additional false positive.
Neither mode from EmailListVerify (ELV) provides meaningful coverage on a catch-all list: both leave between 94% and 96% unresolved and find fewer than 30 of the 500 real people. Therefore, EmailListVerify is potentially a poor fit for catch-all email verification, and it appears this segment of verification may not be a focus for the team. Potentially SMB or B2C emails are more an area this tool shows strengths.
10. Debounce: 26 of 500 real contacts found
Debounce found 26 of 500 real people (5.2%), called 1 of 5,000 invented addresses valid (0.02%), and left 9,480 of 10,000 records records unresolved (94.8%).
That single error is the joint-lowest count in the study, tied with Bouncify, and it is the clearest illustration of why the false-positive column should be considered in the context of coverage. Judged on errors, Debounce looks almost flawless. Judged on if the solution helped verify a target list, Debounce only found 26 of 500 people and handed back 94.8% of the list undecided. Meaningthe error rate is low, but in the context of providing only 27 verifications intotal, the helpfulness of the solution is highly limited.
Based on this data, Debounce has a low error rate earned with very limited coverage, meaning B2B lists might be left largely unverified by the solution.
11. Bouncify: 22 of 500 real contacts found
Bouncify found 22 of 500 real people (4.4%),called 1 of 5,000 invented addresses valid (0.02%), and left 9,561 of 10,000 records undecided (95.6%).
Bouncify and Debounce produced almost the same outcome: one false positive each, 22 and 26 people found, 95.6% and 94.8% left undecided. To their credit, neither tool called more than a single invented address valid, so the risk of a bounce from the few contacts they did mark valid is close to zero.Two separate vendors landing this close together suggests a characteristic of an approach rather than a quirk of one product: when a tool treats the catch-all response as the end of the inquiry, the result is low errors and very few contacts you can actually use in production.
The biggest risk with Bouncify and similar tools with lower coverage is actually that users either significantly limit their market by eliminating many valid contacts due to ‘catch-all’ / ‘unknown’ results, or even worse, blindly send to the ‘unknown’ segment leading to many invalids getting included in lists.
What this means if you are buying an email verification tool?
The study points at a few things to consider when you next evaluate a vendor.
- Review unresolved rate alongside the accuracy figure: An accuracy % on its own cannot be evaluated, because you cannot tell whether it was earned by deciding correctly or by declining to verify large segments of contacts.Several of the tools in our study achieve ‘high accuracy’ by resolving only the easiest emails to verify, leading to very low coverage and inconclusive results across most B2B data. On the other hand, a close to non-existent unresolved rate (below 1%) could indicate an overly aggressive approach, where guesswork or a default invalid status is used as the final step in the verification flow.
- Test on your own catch-all and enterprise domains: A generic test list may not tell the full story. For a B2B team, the domains where verification is hardest, catch-all and enterprise domains, are the ones many members on your team target, and that is where the differences show up. Every domain in this study was a catch-all for exactly that reason.
- Treat an unresolved result as a risk, not a neutral outcome: An ‘unknown’ feels like a safe non-answer, but it often drastically reducesTAM, while introducing risk into your data-sets as these records that are unverified often get emailed by your team anyway. If a tool leaves 95% of your list undecided, most of your list remains unverified and the risk of that data being emailed is very high.
- Be wary of a near-perfect accuracy claim with no coverage figure attached. The cheapest route to a clean error rate is a low resolution rate, and several tools here did exactly that. It is a design choice about which failure to avoid, and the buyer is the one who lives with it.
- Where Allegrow fits: Allegrow found 491 of 500 real people (98.2%), the most of any tool tested, with 11 false positives in 5,000(0.22%) and 2% of records unresolved. Allegrow currently offers a strong combination of coverage and accuracy on catch-all domains. Combined with clear governance, a fast moving roadmap and a complete SOC 2 audit for enterprise buyers.
Run this test yourself
You do not need our data to check any of this. The method is straightforward, and running it on your own list is more useful than any published benchmark, because it uses the domains you actually sell into.
- Choose your domains, and confirm they are catch-all. Pick companies from your own target list rather than a generic sample, then check which domains are catch-all and accept mail to an address that cannot exist. Any serious verification tool you already use should provide you with the domain configuration of your leads. If you skip this step you are testing general accuracy, not catch-all performance, and the results will look much better than they actually are.
- Identify real people you can confirm independently. You need ground truth, and the strongest form of it is a reply. If someone answered your email last month, that address works, whatever a tool says about it. After replies then comes your CRM, then public professional profiles. We used public profiles for this study because we cannot publish data about people who have emailed us, but that constraint does not apply to you. Your own reply history will give you a sharper test than ours.
- Generate the permutations. For each person, build the standard formats against their company domain: first.last@, flast@, f.last@, first@ and the rest. If you need help, we have an article mentioning the most common email formats for businesses. Around ten per person is enough.
- Build a control group of obvious fictional names. Use clearly invented people at those same real domains, and make them obvious. This is the only part of your list where you know for certain that no mailbox should exist, so it is the only clean way to catch a tool calling something valid when it is not.
- Run every tool on the identical list.
- Count the three numbers separately. How many of your real people did each tool find, counting a person as found if any one of their permutations came back conclusively valid. How many of your invented addresses did it call valid. And what share of the whole list did it leave undecided, using one consistent rule across vendors, since they all use different words for uncertainty.
The principle underneath all six steps is ground truth. Without knowing the right answers in advance, a comparison can only tell you which tool reports the highest percentage of something, and an arbitrarily high number is easy to claim.
Get the full dataset
The complete results file is available on request. It contains the full per-tool output across all 10,000 records, the list of all 251 catch-all domains, and the status each tool returned for every address, so you can check our counts or rerun the comparison against a tool we did not include.
The results are published for informational purposes and are designed to give you a framework for running your own assessment, on the domains and contacts that matter to you.
How to cite this study
If you are quoting these results, here is everything you need to attribute them correctly.
Study: Allegrow Catch-All Email Verification Benchmark
Publisher: Allegrow
Date: August 2026
Sample: 10,000 addresses at 251 catch-all domains, made up of around 5,000 name permutations for 500 real professionals and 5,000 invented addresses, tested across 11 tools in 14 tests
Metrics: real contacts found (out of 500), false positives (out of 5,000), unresolved (out of 10,000)
Canonical URL: https://www.allegrow.co/knowledge-base/best-email-verification-tools-benchmark
Suggested citation: Allegrow, "Catch-All Email Verification Benchmark," August 2026, https://www.allegrow.co/knowledge-base/best-email-verification-tools-benchmark
Conclusion
The measurement was simple. Take 10,000 addresses at 251 catch-all domains, hide 500 real people among 5,000 invented ones, and see which tools can tell the difference. Most could not: seven of the fourteen tests left at least 94% of the list unresolved, and six of those found fewer than 45 of the 500 real people.
Accuracy alone cannot separate those two groups, because a tool with minimal coverage produces a very low error rate by only verifying the ‘easier’ contacts. Coverage is the statistic that helps you understand how useful a verifier will be across all your potential or existing customers. Weighting this test list toward larger businesses, helps you evaluate which tools meet a minimum bar for verifying most of the people you want to reach by email.
Allegrow found 491 of the 500 real people, more than any other tool tested, with an error rate among the lowest recorded. The next best results were 470, 467 and 460, from ZeroBounce and BounceBan. Beyond the raw numbers there is a commercial difference: both alternatives price per verification(Allegrow has an unlimited option). There is also a potential difference in how Allegrow approaches sourcing signals and data for email verification compared to these other options: near-zero unresolved rates are typically achieved through test sends or non-email data sets, whereas Allegrow bases every rating on email server data. This means if you choose Allegrow you can scale verifications with an unlimited plan while being sure the valid vs invalid results are based on email servers, rather than defaults or alternative data sources.
To summarize some of the differences between the three top performers at the time of writing:
Commercially Allegrow's unlimited plan usually starts to be interesting when team are doing above 160,000 verifications a month, specifically with teams who want premium email warmup and multiple deliverability features to help them reach the primary inbox.
To give a working example of the way the plans scale, at the time of writing, Allegrow’s monthly cost is $326 less than ZeroBounce when you do 500,000 verifications, and at least $1,159 less when you reach over 1 million verifications, with the gap widening from there for scaled B2B use-cases.
This comparison across many vendors should help you have a framework to create your own data test, with awareness on some of the most common challenges and limitations in the email verification industry.
To see how this plays out with your own contacts, start a 14-day free trial with 1,000 free verifications. The full dataset from this study is available on request during your evaluation process.
Frequently asked questions
What are the best email verification tools in 2026?
We tested 11 tools on 10,000 addresses across 251 catch-all domains. Ranked by how many of the 500 real people each one found: Allegrow 491, ZeroBounce 470 at best across its three modes, BounceBan 460, Hunter.io 427, then a steep drop to NeverBounce at 151 and Million Verifier at 147. The remaining five found fewer than 45 each and left 94% to 96% of records undecided.
How accurate are email verification tools on catch-all domains?
It varies enormously. In our August 2026 test of 11 tools, real contacts found ranged from 4% to 98.2% of 500 real people, meaning 20 people at the bottom and 491 at the top. Seven of the fourteen tests left at least 94% of all 10,000 records undecided, so on catch-all domains most tools resolve very little.
Why do email verification tools return "catch-all" or "unknown"?
Because a catch-all domain accepts mail addressed to anyone, so the standard SMTP check learns nothing from the server saying “accept”. It would say “accept” to a real employee and to an invented name alike. A tool that stops at that response has no basis for a decision and returns uncertainty instead.
Can any tool verify catch-all email addresses?
Some, out of the 11 tools tested, only 4 had a reasonable number of resolved valid contacts. Allegrow found 491 of 500 real people, ZeroBounce with Verify+ found 470, ZeroBounce standard 467, BounceBan 460, and Hunter.io 427.
Which email verification tool performed best on catch-all domains?
Allegrow, on the measure that determines how many people you can reach. It found 491 of 500 real contacts (98.2%), ahead of ZeroBounce with Verify+ at 470, ZeroBounce standard at 467 and BounceBan at 460, while calling 11 of 5,000 invented addresses valid (a level between the lowest error rates recorded) and resolving 98% of the full 10,000-record list.
What should you ask a verification vendor besides their accuracy rate?
Ask this: on catch-all domains, what share of addresses do you return a definitive valid or invalid for, rather than "catch-all" or "unknown"? An accuracy figure only covers the records a tool chose to decide on, so on its own it tells you almost nothing. In our test, tools making only one or two errors in 5,000 left 94% to 96% of records undecided. They were accurate. They were also useless.
Which domains were tested?
All 251 are catch-all domains, spanning big tech, developer infrastructure, fintech, industrials, media and life sciences. Recognisable names in the set include Google, Netflix, Stripe, Nvidia, Databricks, Honeywell, BP and The New York Times. The full list comes with the dataset, which is available on request.

.jpg)
.jpg)
.jpg)